I Analyzed 14 Million Chess Games.
Knights hopping 106 million pieces. Kings delivering checkmate. Pawns with savage K/D ratios. Here's what I found analyzing millions of chess games in the Lichess database.
My friend Benny Rubanov and I wrote an analysis engine to calculate previously unquantirfied chess stats. We ingested 13,948,545 games from the Lichess Database looking to answer questions ranging from how popularity of the Bongcloud opening has changed over time to which piece had the best K/D ratio; the restuls were weird but fun! Here's a teaser of some highlights:
- Max capturer-to-captured (K/D) ratio = 3.13944 - The piece with the highest number of captures relative to times it is captured. That would be the black king!
- Pieces "hopped" by knights = 106,140,091!!! 🐴
- Number of games with the bongcloud opening = 0 😮*
- White-to-black win rate ratio of the Sicilian Defense = 0.85299 😏 - For every game black wins with the Sicilian, white wins only ~0.85 games. The Sicilian's reputation as one of black's strongest responses to 1. e4 is well-earned!
*We detected openings by ECO (Encyclopedia of Ches Openings) code, as tagged by Lichess. The bongcloud (1. e4 e5 2. Ke2) may not have a standard ECO classification in the dataset.
Why do this? The idea originated trying to guess which piece would have the highest "kill-to-death" ratio (i.e. captures more than it is captured) and grew from there :). I hope you enjoy seeing these stats as much as I enjoyed putting them together!
ℹ️ Here are the results of the "kill-to-death" ratio question. The black king leads all pieces! Note that a checkmate is considered a "capture" of a king.
🧑💻 All code is open source. See github.com/bennyrubanov/chessanalysis
Results
We calculated 6 categories of metrics:
- Game Metadata
- Captures
- Mates & "Assists"
- Promotions
- Moves
- Miscellaneous
Game Metadata
| Metric | Value |
|---|---|
| Number of Games Analyzed | 13,948,545 |
| Average Player Rating | 1618.143982 |
| Average Rating Difference | 102.8473008 |
| Largest Rating Difference | 1913 |
| Largest Rating Difference Game | lichess.org/HiDtrGHX |
The most popular game format was blitz by number of games played!
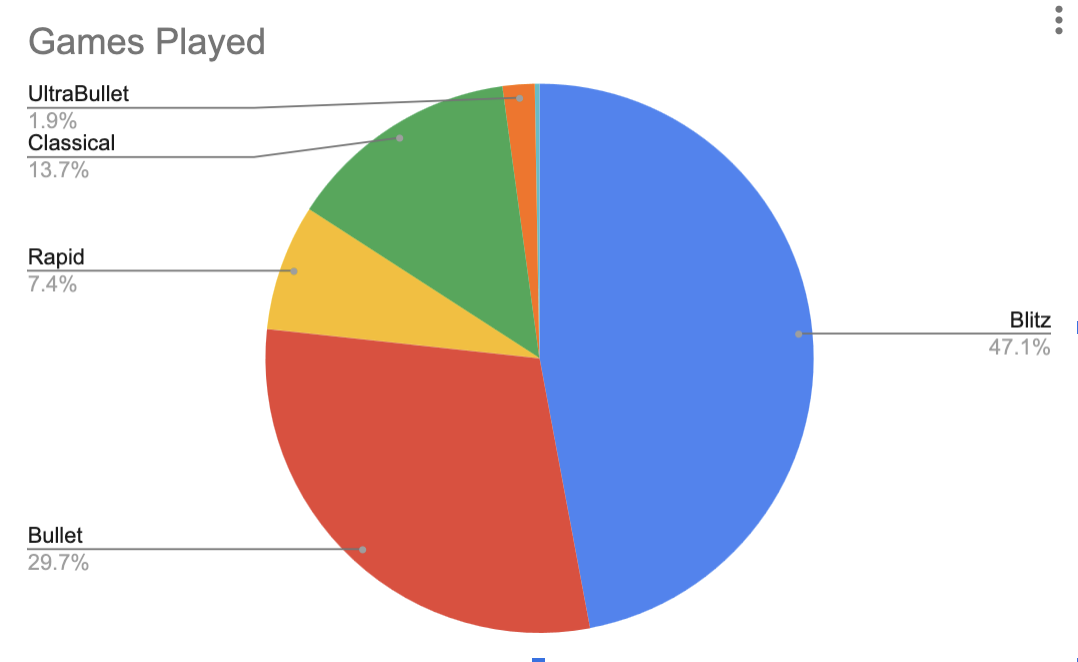
Note that this doesn't weight by time spent. Games in the classical variant are ≥ 1500s, while bullet is < 179s, so we can infer that time spent playing classical exceeds bullet! lichess.org/faq#time-controls
And the most popular time controls...
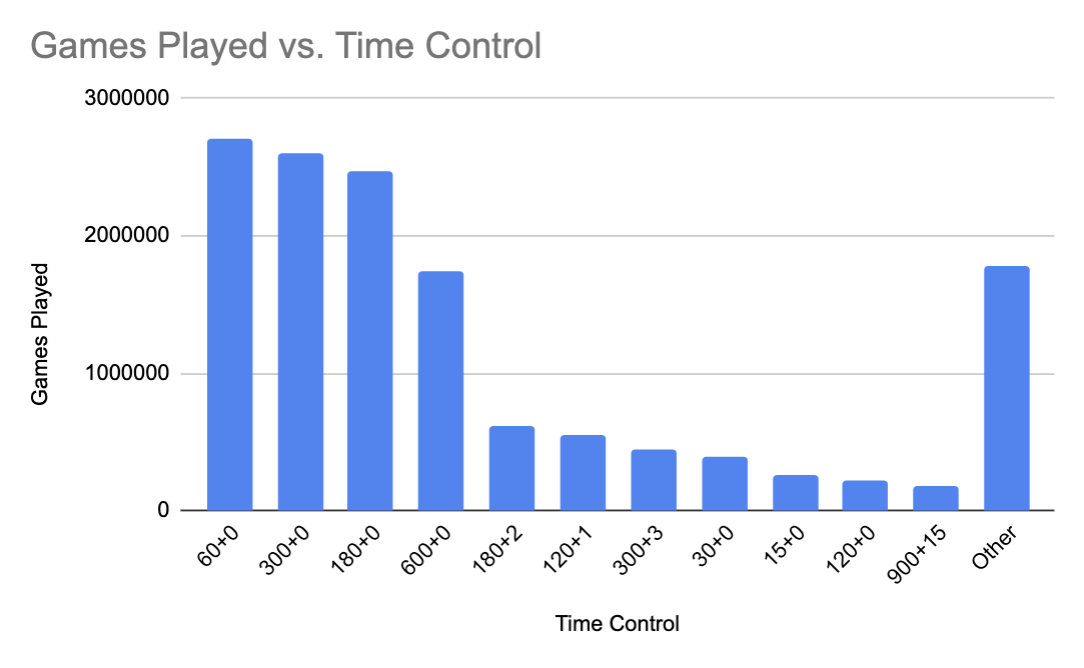
Any control appearing in less than 1% of games is not shown.
Captures
In many of our charts, pieces are labeled using their "Unambiguous Symbol" (UAS)—a unique identifier we created to distinguish individual pieces. Here's a quick reference:
💡 UAS Legend: White pieces are uppercase, black pieces are lowercase. The first letter indicates piece type (P = pawn, N = knight, B = bishop, R = rook, Q = queen, K = king) followed by its starting column (a–h). For example, = the white a-pawn, = the black b-knight, = the white queen. See the Methodology section for more on why this was necessary.
Here is the full UAS table:
| White piece name | UAS symbol | Black piece name | UAS symbol |
|---|---|---|---|
| White a-pawn | Black a-pawn | ||
| White b-pawn | Black b-pawn | ||
| White c-pawn | Black c-pawn | ||
| White d-pawn | Black d-pawn | ||
| White e-pawn | Black e-pawn | ||
| White f-pawn | Black f-pawn | ||
| White g-pawn | Black g-pawn | ||
| White h-pawn | Black h-pawn | ||
| White queen's rook | Black queen's rook | ||
| White queen's knight | Black queen's knight | ||
| White queen's bishop | Black queen's bishop | ||
| White queen | Black queen | ||
| White king | Black king | ||
| White king's bishop | Black king's bishop | ||
| White king's knight | Black king's knight | ||
| White king's rook | Black king's rook |
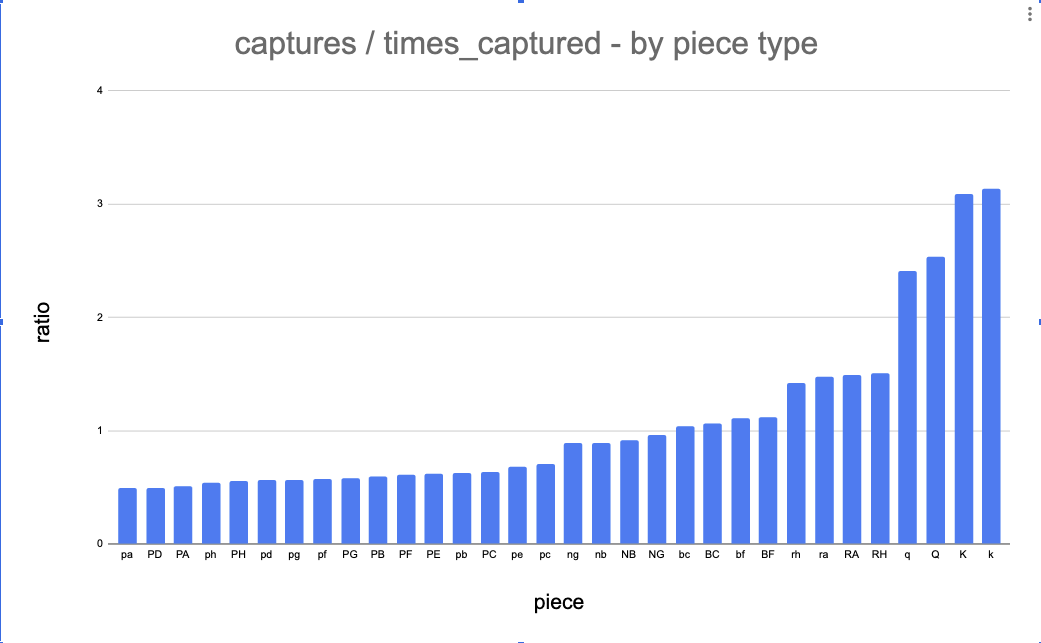
Let's take another look at kill-death (KDR) ratios:
The data mostly matches intuition. Pawns have the worst KDR, then knights, bishops, rooks, queens and kings. Before seeing the data I wasn't sure whether kings or queens would come out on top (a classic question of offense vs. defense). I suspected queens might get a boost from more aggressive queen play by lower ELO players! However they may also blunder the queen more often to make up this difference—until we see the data sliced by ELO (which we plan to do in our next analysis) we can only hypothesize!
One surprising thing was the black king edging out the white king in KDR. The black king is mated ~12.8% more often than the white king. However the black king captures enough pieces (~14.3% more) to make up the difference and take first place!
| Piece | Kills | Deaths | Total | KDR (Kills / Deaths) |
|---|---|---|---|---|
| Black king | 6,171,648 | 1,965,846 | 8,137,494 | 3.13944 |
| White king | 5,399,308 | 1,742,619 | 7,141,927 | 3.09839 |
The data may match intuition, but there's another way to look at it. We've been counting each "kill" and "death" as one unit. But this doesn't account for the value of the pieces captured! Below is that same data with deaths and kills weighted by point value (source):
- Pawn = 1 point
- Knight = 3 points
- Bishop = 3 points
- Rook = 5 points
- Queen = 9 points
- King = 4 points (our analysis required assigning a numeric value to kings; among sources that do so, 4 is the most commonly used value)
Weighting captures and deaths is slightly more complicated than calculating . Weighted KDR is calculated as:
Here are the results of that calculation:
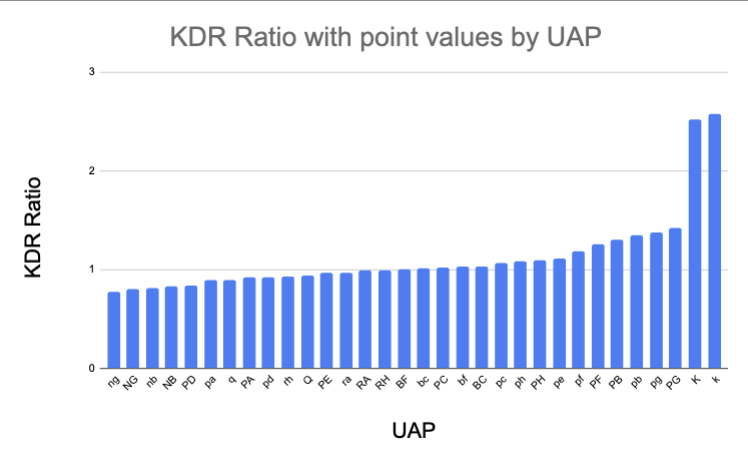
Now, kings are the clear winners! Which makes sense—at most one of two kings can be "captured" per game (for our purposes a mate = capture), they have a mid-range piece value and they often capture high-value pieces.
You might be surprised to see spots 3-10 occupied by pawns. The reason is how we track captures: a promoted pawn retains its original UAS for kill tracking and when it is captured we still use a point value of as its UAS value. So it makes sense that the highest KDRs (besides the kings) belong to pawns nearer the edge of the board which, as you'll see, promote more often.
It's also interesting to see that knights now rank dead last, queens are nearer to the bottom, and bishops trail only kings and some pawns. This is another place where it would be interesting to see slices by ELO, as we hypothesize that lower ELO players are more susceptible to losing high value pieces to knight forks (or simple mistakes!). Maybe they'd have a chance to be outside last place in that view!
As to why knights rank dead last: perhaps knights are involved in far fewer mates than other piece types or make it to endgame less often (they are often sacrificed earlier in games).
We also pulled some fun stats on "revenge kills" and "kill streaks". I won't cover those but you can find them in the raw data or read more about methodology in the github repo!
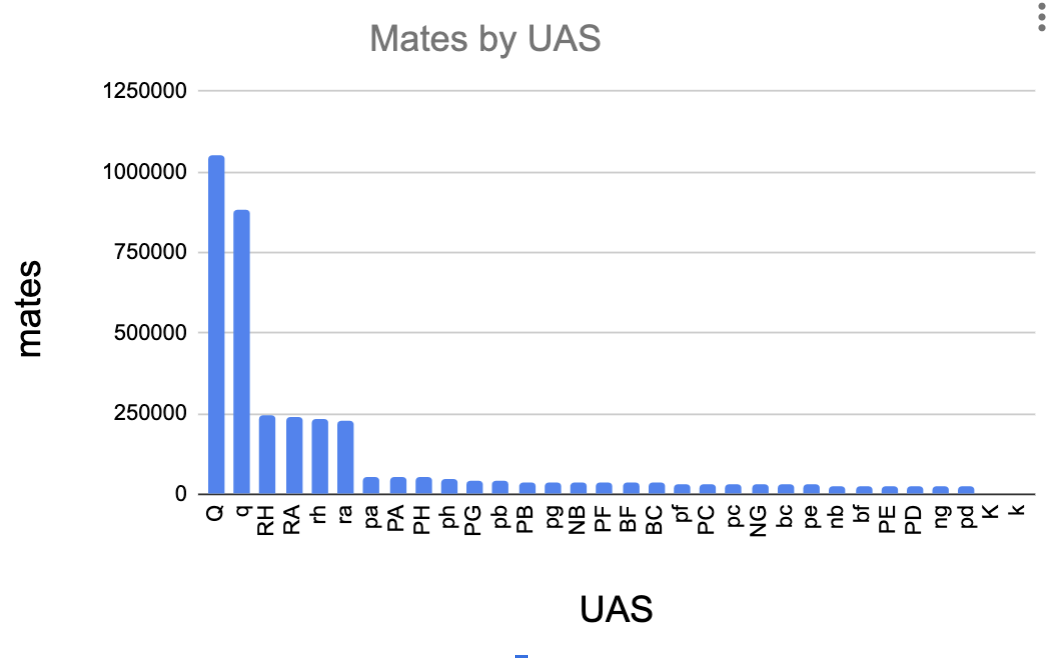
Mates & Assists
There were no real surprises here. Queens hold a massive lead, followed by rooks while kings are dead last. And in all instances the white pieces lead black.
The more interesting visual is when not considering any of the top 6 pieces. Here's that same data without queens or rooks. You can now see that kings actually have some mates ⁉️; this is possible because of how we assign mate in the case of discovery checkmates.
It's possible for the piece that causes checkmate to be different than the moving piece, or for multiple pieces to simultaneously deliver checkmate! To simplify things for our analysis, "checkmate" is assigned to whichever piece made the final move in the game, and in some rare cases (1061 out of 13 million) a king move led to a checkmate!
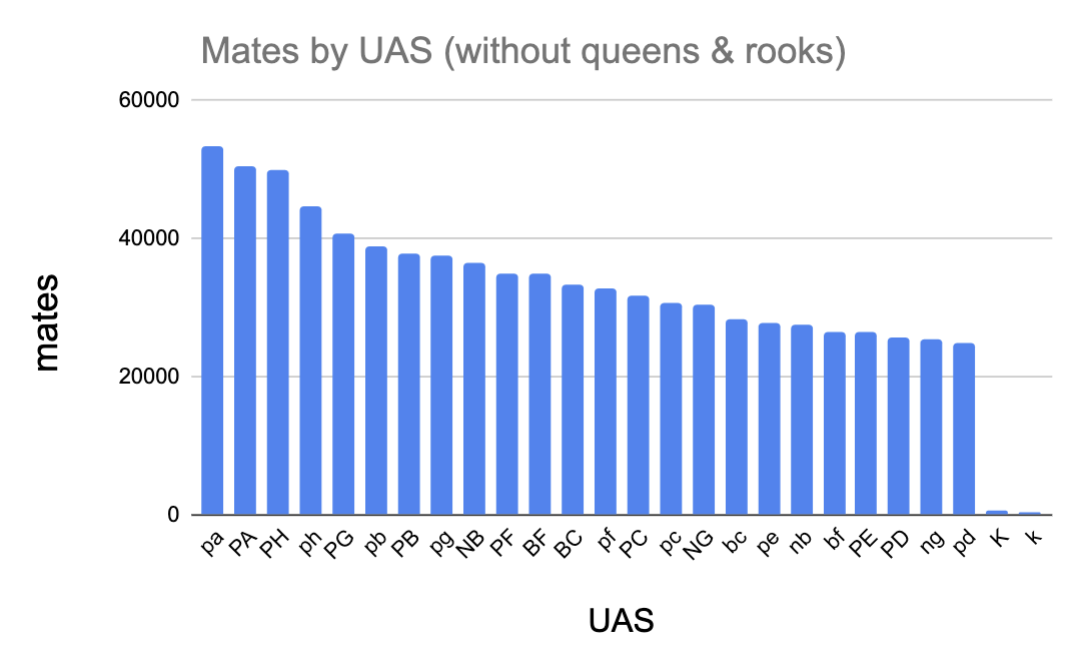
Pawns on columns A and H lead the mate count. Because these edge pawns promote most often (as shown in the Promotions section below), they frequently become queens or rooks that go on to deliver checkmate—but the original pawn still gets credit under our UAS tracking.
The most difficult result to interpret is why the knights fall where they do. The white queen's knight () performs the best, leading all bishops and knights, as well as all interior (middle 4) pawns, while the black king's knight () is only ahead of the black d-pawn and the kings. My best guess would be this knight is part of some common trap openings? Happy to hear any other ideas on this.
Assists
We wanted to get a little sporty with our calculated metrics, so we also developed a concept of "assists" and "hockey assists" for this analysis.
Definitions:
Assist - The move preceding checkmate causes check, and is done by a different piece.
Hockey Assist - The move immediately preceding an assist is a check, and delivered by a different piece.
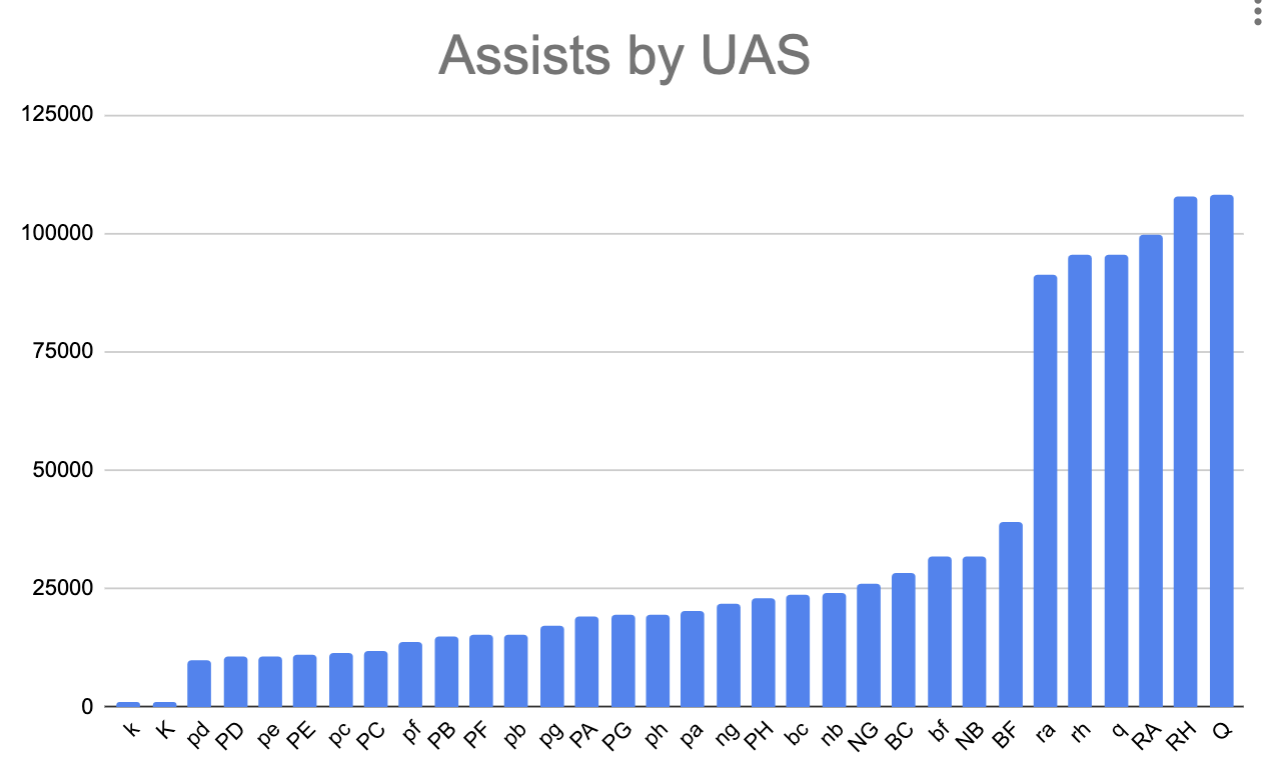
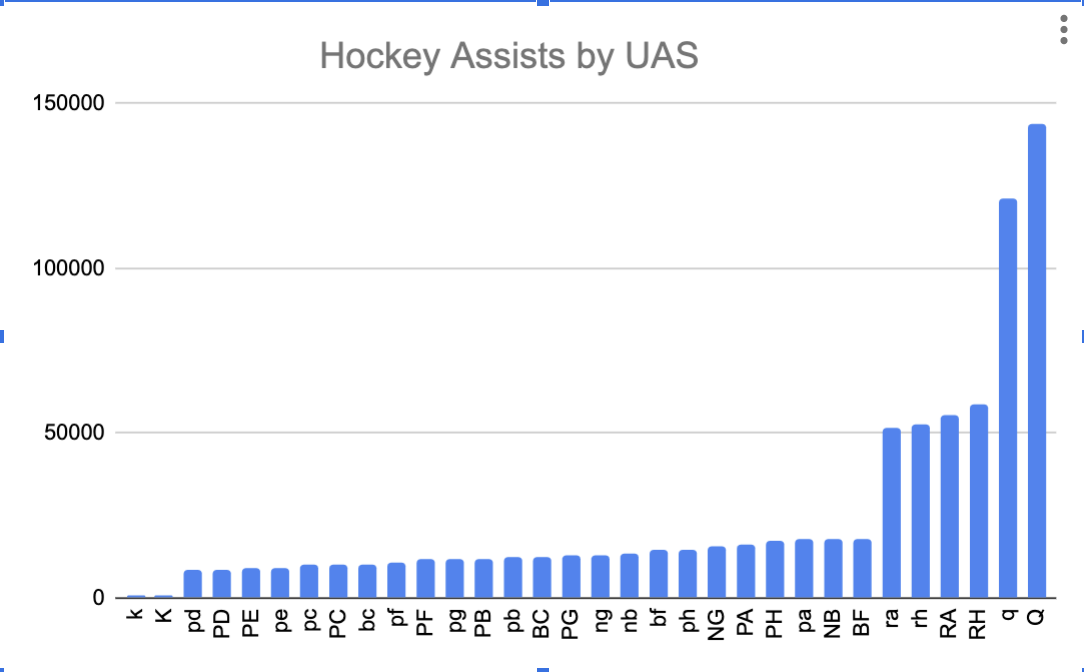
One big surprise here is that individual rooks assist nearly as often as their corresponding color's queens, however trail by a wide margin again when looking at hockey assists. Not only that, but the total number of hockey assists that queens provide is actually higher than their assist totals!
We can likely point to methodology for this result. It's possible for a piece to "hockey assist" itself, as long as it is not also the "assisting piece". Because queens constitute such a high percentage of the total checkmates delivered, being able to hockey assist to their own mates makes a big difference.
Promotions
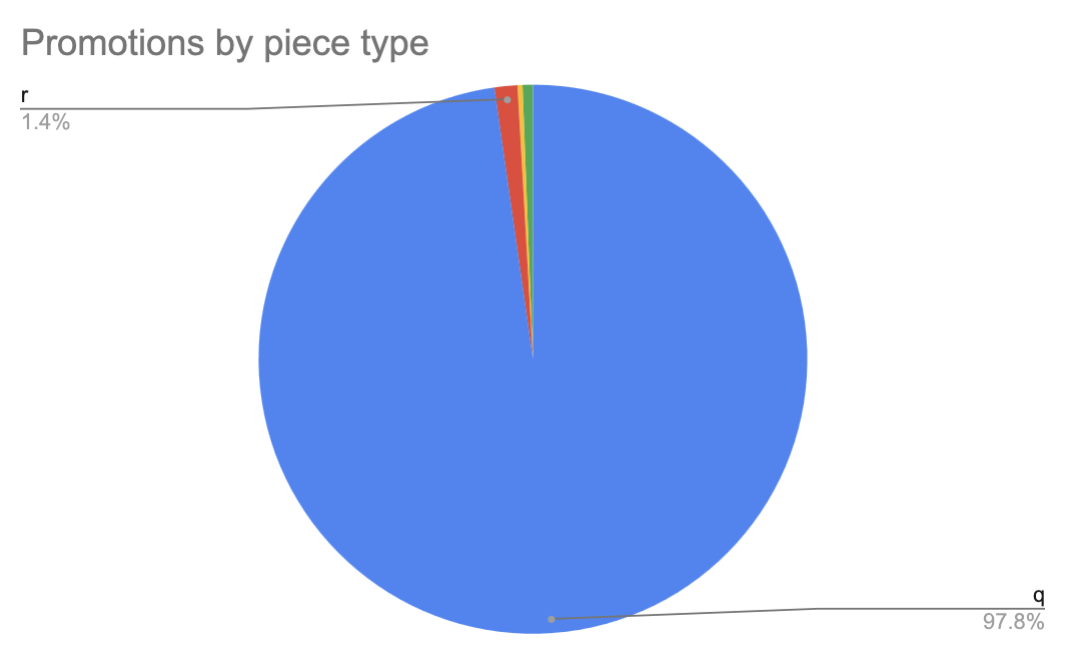
No major surprises in the top level numbers here: queens dominate the promotion totals. There are some genuine edge cases where promotions to other piece types make sense; that being said I'd guess that a significant number of the non-queen promotions are deliberately suboptimal plays (likely to disrespect the opponent) rather than being the optimal move 😁.
| Queen | Rook | Knight | Bishop |
|---|---|---|---|
| 2,454,291 | 34,021 | 15,159 | 7,288 |
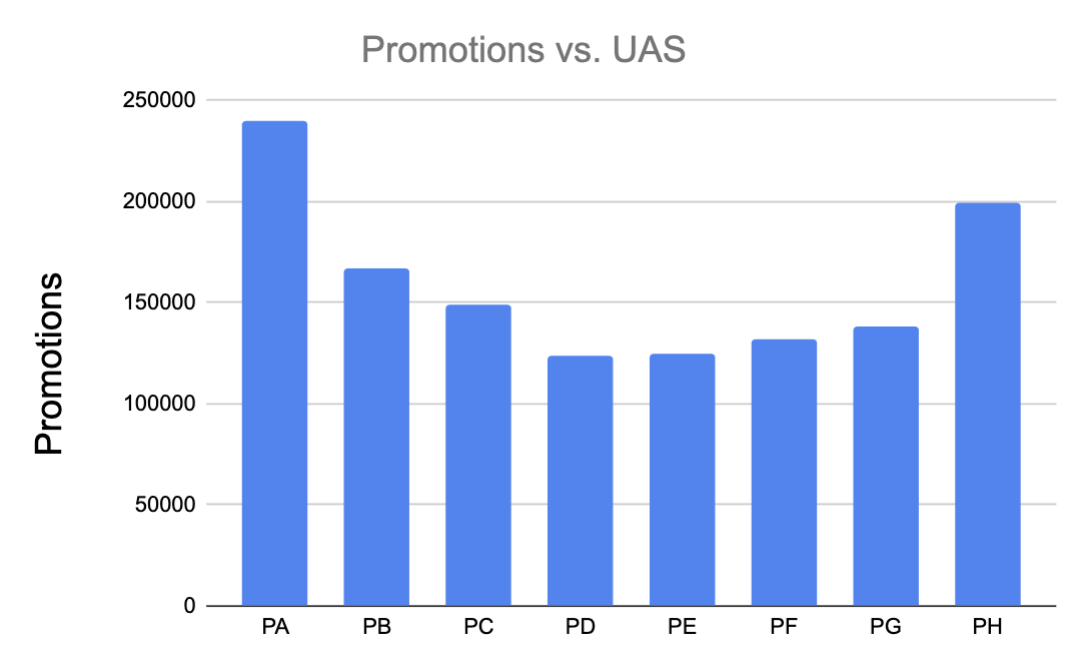
The more interesting view here is to look at the promotion totals by pawn positions.
Looking at just the white pawns from column A → H, we see that the outermost columns promote the most often, with the A column leading.
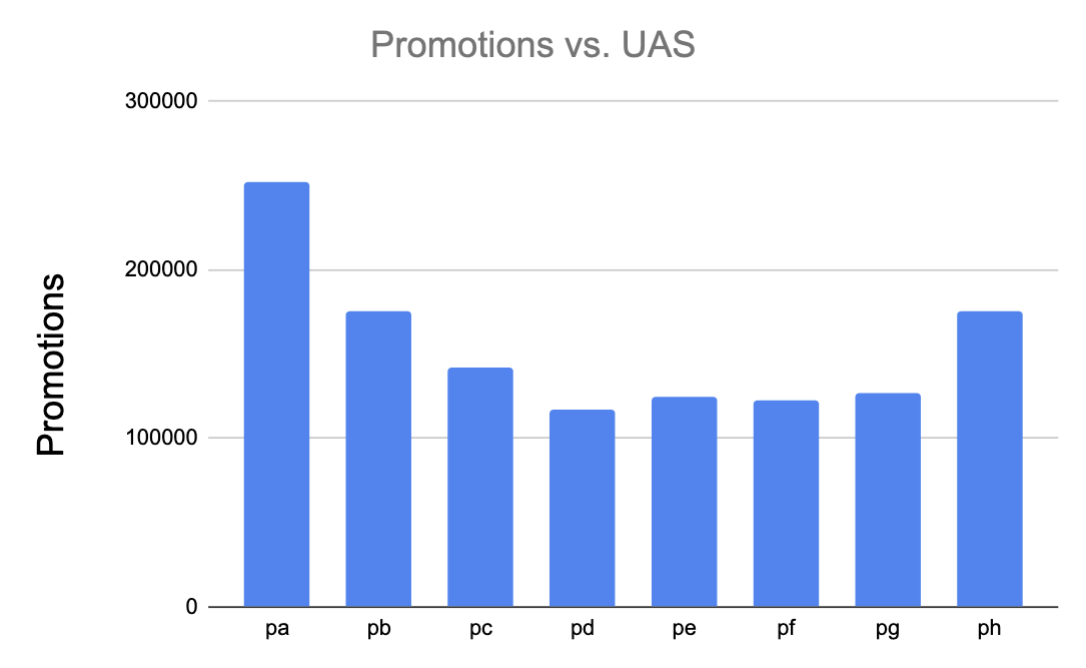
For the black pieces the chart is fairly similar, though it's notable that the b-pawn actually promotes slightly more often than the h-pawn (175,514 vs. 175,349 promotions). The d-pawn is least likely to make it across the board for both black and white.
Moves & Distances
Here's a view of average move distance by piece type with a few quirks worth explaining.
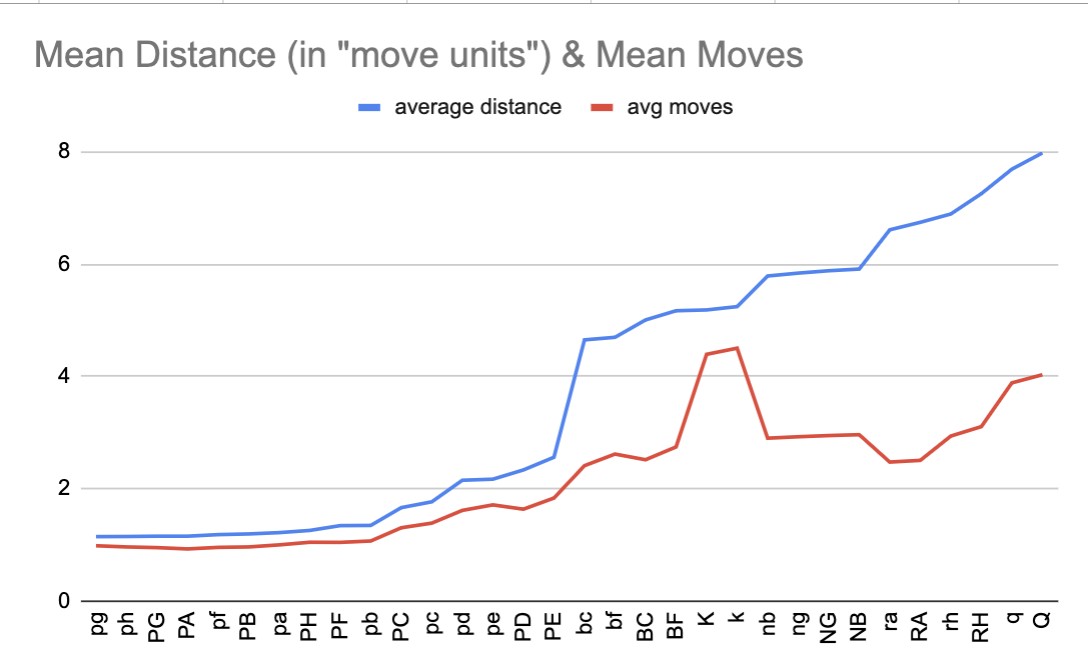
To calculate distances moved, we defined a concept of a "move unit" which defines distance in terms of board squares. "Diagonal" movements are considered one move unit for this purpose, meaning a move from a1 → b2 = 1 move unit. This means every knight move is counted as 2 move units.
Another special case is castling, in which case both a rook and king will have distances added to their total in the same move. Both also have their move totals incremented, meaning the sum of piece moves in a game can be greater than total moves.
Some interesting takeaways:
- Pawns and kings both have average distances that differ from their average moves, despite only being able to move one square per move. For kings this is attributable to castling, which is a move of > 1 move unit. For pawns there are two reasons: the optional two-square advance on a pawn's first move, and promotions—after which the promoted piece can cover even greater distances.
- The biggest surprise here is that knights lead bishops in movement distance, though it's worth noting that if our definition of movement counted "diagonal" as 2 squares bishops would 2x their total covered distance and knights would 1.5x, putting bishops in front. We'd get increases for queens, kings & pawns as well.
And of course the most important takeaway:
Credits to Benny for the graphic
Raw castling numbers show that castling happens in a supermajority of games (sample size is ~13 million), mostly to the kingside.
| Castling type | Times castled | Percent of total castles |
|---|---|---|
| Black kingside | 8,752,474 | 84.72% |
| Black queenside | 1,578,689 | 15.28% |
| Total | 10,331,163 | - |
| White kingside | 9,324,926 | 84.38% |
| White queenside | 1,725,751 | 15.62% |
| Total | 11,050,677 | - |
Miscellaneous
Some last fun numbers!
| Metric | Value |
|---|---|
| Number of en passants | 208,881 |
| Number of pieces hopped by knights | 106,140,091 |
| Piece with most moves played in single game | Black h-rook |
| Num moves played in that game | 290 |
| Game this occurred in | lichess.org/zlPR0Jzw |
Methodology
We owe a big thanks to the developers of chess.js (another great open source project). We took advantage of some helpful methods written for the library to save ourselves development time.
We also owe thanks to the maintainers of Lichess. All data used in this analysis comes from the Lichess open games database.
Approach
The steps to the analysis can roughly be broken into:
- Fetch & decompress game data
- Convert chess Portable Game Notation (PGN) into move history & board state
- Apply metric functions to games
- Aggregate all metrics across games
1. Fetch & Decompress
Fetching & decompressing raw data is fairly straightforward. However the scale of data presented challenges later—Lichess data for recent months can be rather large (~100,000,000 games per file, ~32.5 GB compressed).
2. Convert PGN format into move history & board state
Portable Game Notation (PGN) is the format of games in the lichess database. While PGN can be used to reproduce the full history of moves and board states for a game, most statistics we are interested in cannot be directly calculated from PGN.
A sample chess game as PGN:
[Event "Rated Classical game"]
[Site "https://lichess.org/j1dkb5dw"]
[White "BFG9k"]
[Black "mamalak"]
[Result "1-0"]
[UTCDate "2012.12.31"]
[UTCTime "23:01:03"]
[WhiteElo "1639"]
[BlackElo "1403"]
[WhiteRatingDiff "+5"]
[BlackRatingDiff "-8"]
[ECO "C00"]
[Opening "French Defense: Normal Variation"]
[TimeControl "600+8"]
[Termination "Normal"]

1. e4 e6 2. d4 b6 3. a3 Bb7 4. Nc3 Nh6 5. Bxh6 gxh6 6. Be2 Qg5 7. Bg4 h5 8. Nf3 Qg6 9. Nh4 Qg5 10. Bxh5 Qxh4 11. Qf3 Kd8 12. Qxf7 Nc6 13. Qe8# 1-0
For example, we track how many pieces are "hopped" by knights. To do this we need to know:
- Which knight made a move
- Which square that knight started on
- Where all other pieces are on the board
This information is not readily available in PGN. PGN only contains an ordered set of moves. To determine 1 & 2 we defined a unique identifier called "Unambiguous Symbol" (UAS) and reconstructed "move history" with this information (see the UAS legend in the Results section for a quick reference). For item 3 we create a snapshot of "board state" at every move.
Illustrating further why PGN falls short:
Many games start with the sequence 1. e4 e5. This means the e2 pawn advanced to e4 and the e7 pawn advanced to e5. However, we only know this because we know how chess boards are set up—only the destination squares are stored in PGN!
Because chess games always start with the same board configuration, e4 e5 is enough information to determine board state. So with PGN if only one valid move to a square exists and that move is made, PGN stores only the destination square. This means we must be aware of board state at every move in order to know which piece made it, and from where.
Consequently, the first step in analysis was to create a move/board state history, leveraging methods from chess.js. Unfortunately our implementation on top of chess.js quickly ran into scale issues.
Creating move history and board state takes ~4ms (0.004 seconds) on average. This is fine at small scale, but doing this for all ~14 million games takes roughly 15.5 hours (on a single thread), just for preprocessing!
3. Apply Metric Functions
Once we created "move history" and "board state history" for each game, we applied our metric functions. These functions calculate all the statistics of interest, such as # of captures, # of mates, revenge kills etc.
4. Aggregation
Metrics are calculated per-game and stored as raw totals. Once those totals cross a certain threshold we apply weighted aggregations to provide usable statistics!
Challenges
The greatest challenges in this project were related to the scale of the data. They included:
Converting PGN into board state
As mentioned above, this step takes a significant amount of time & becomes a bottleneck when dealing with games on the order of millions → billions. There are a few things that could be done here:
- Change how move history is built - The current implementation calculates all possible moves then finds the only valid one from that set. This makes sense for the chess.js use case (which we are leveraging for the conversion), however in our use case the logic could be optimized to early exit when a matching move is found, provided we make the assumption that the PGN is valid. We could also change how board state is stored/calculated.
- Caching common openings - We save on calculation time by caching common board states, and potentially apply this in later game situations too.
- Use other tools/languages/libraries - For CPU intensive/data heavy tasks Node.js is not the optimal choice.
There are plenty of other ideas here, like working backwards from a destination square to find valid moves as opposed to starting from a piece, building separate services for move history, having a dynamic board state instead of one per move and more! Some deep performance testing would probably tell us where to focus.
Handling concurrency
Given the speed limitations of our current analysis methods the natural next option to consider is horizontal scaling. It might take ~16 hours to process 14 million games with a single thread, but scale that up to 8 concurrent processes and we need ~2 hours!
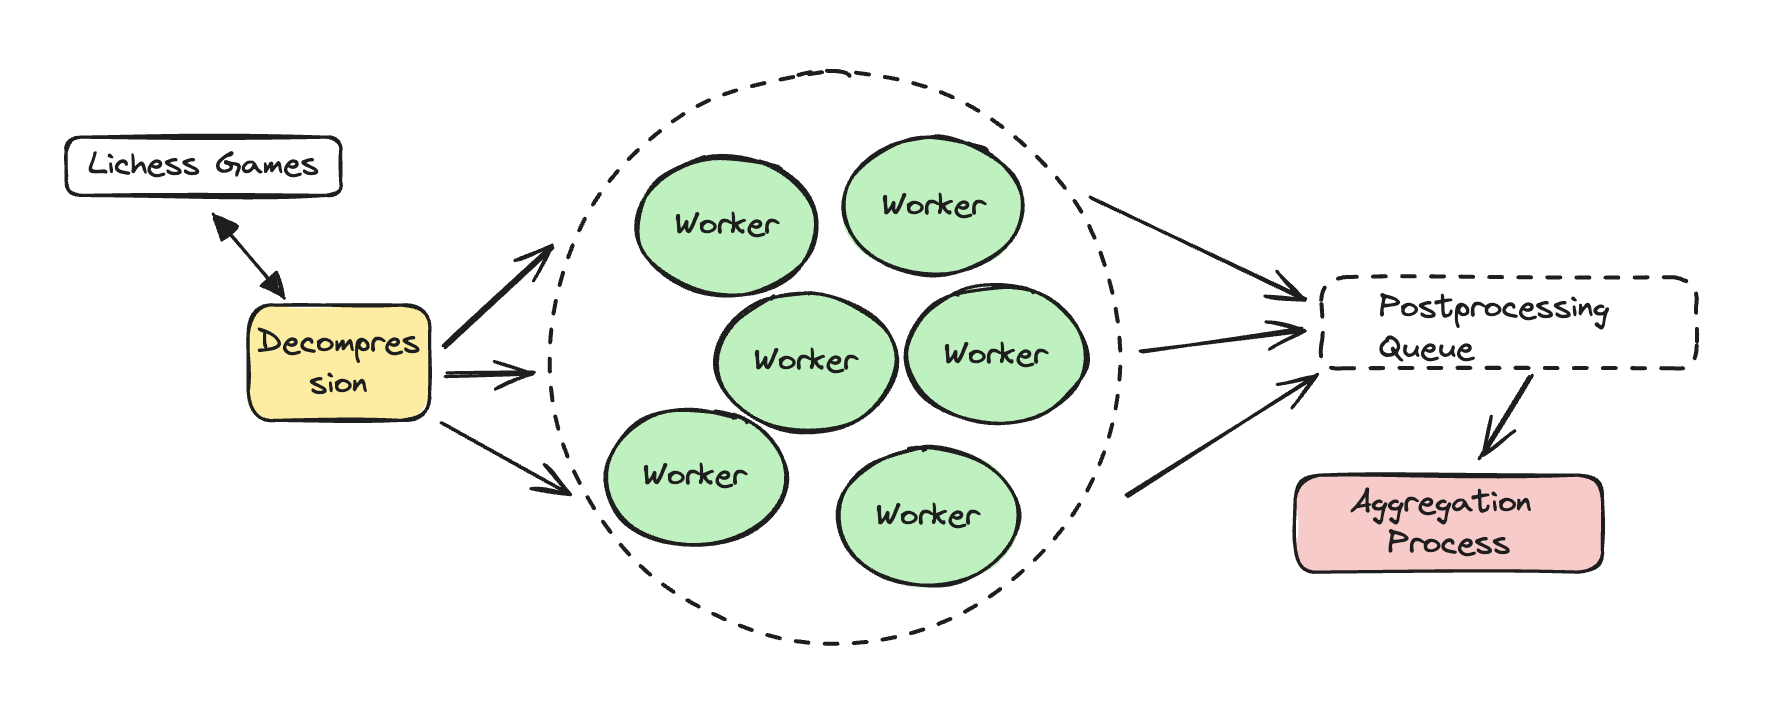
There are a few different paths that could be chosen for handling concurrency. We ultimately chose to create a set of workers that focus on game history and analysis (the bottleneck is these steps) and which publish to a processing queue that is consumed by a single aggregation process to ensure no overwrites/race conditions in the aggregation steps.
The system for processing games looks roughly like this:
Final thoughts
Thanks for making it all the way to the end of this blog! If you haven't had enough yet, Benny has built a fun web app that leverages our metrics ability to calculate statistics for your own games on both chess.com and lichess! That's live at chessis.fun, check it out!
Leaving with a tidy summary if you want to send an interesting TLDR
Key findings
- The black king has the highest kill-to-death ratio of any piece (3.14) — despite being mated ~12.8% more often than the white king, it captures enough extra pieces to claim the top spot.
- Knights hopped over 106 million pieces across ~14 million games, but rank dead last in weighted KDR — they tend to be sacrificed early and rarely survive to the endgame.
- Edge pawns (columns A and H) promote far more often than central pawns, and the d-pawn is least likely to make it across the board for both colors.
- Rooks assist on checkmates nearly as often as queens, but queens dominate hockey assists — largely because they can hockey-assist their own checkmates.
- Kingside castling accounts for ~84% of all castles, and white castles more often than black overall.